The crack of the bat, the roar of the crowd, the drama of a runner crossing home plate—baseball is a sport where numbers whisper secrets if you know how to listen. Among these numbers, one stands out like a lighthouse guiding fans through the fog of statistics: OPS. Short for On-base Plus Slugging, OPS is more than just a stat; it’s a prism that refracts a player’s offensive prowess into a single, luminous figure. For those who crave deeper insight into the game, OPS is the Rosetta Stone that unlocks the language of run production. It doesn’t just tell you how often a batter gets on base or how hard they hit the ball; it tells you how effectively they turn those opportunities into runs—the lifeblood of victory. Whether you’re a casual fan or a die-hard analyst, understanding OPS is like gaining a backstage pass to the inner workings of baseball’s most thrilling performances.
The Genesis of OPS: A Marriage of Art and Arithmetic
OPS emerged from the crucible of sabermetrics, the analytical revolution that transformed baseball from a game of gut feelings into a science of probabilities. Before OPS, fans and scouts relied on fragmented metrics like batting average and home runs to gauge a player’s worth. But these stats told only half the story. A batter could hit .300 with 30 homers yet still leave runners stranded on base. Conversely, a player with a modest average might draw endless walks, fueling rallies without the fanfare of tape-measure blasts. OPS was born to bridge this divide, marrying two fundamental offensive skills: the ability to reach base and the ability to advance runners once there.
The formula itself is elegantly simple: OPS = On-base Percentage (OBP) + Slugging Percentage (SLG). OBP measures how often a batter avoids making an out, accounting for hits, walks, and hit-by-pitches. SLG, meanwhile, quantifies the quality of those hits, assigning greater weight to extra-base knocks. By combining these metrics, OPS paints a holistic portrait of a hitter’s offensive value. It’s the statistical equivalent of a chef blending spices—each component contributes its own flavor, but together, they create something far greater than the sum of their parts.
On-Base Percentage: The Silent Architect of Rallies
In the grand theater of baseball, outs are the villainous force that steals the spotlight from heroes. Every out is a stolen opportunity, a chance to score that vanishes like a shadow at dusk. On-base percentage (OBP) is the antidote to this menace. It measures the frequency with which a batter avoids outs, transforming the act of reaching base into an art form. A player with a .400 OBP is a master of patience, a virtuoso who turns at-bats into miniature chess matches, outmaneuvering pitchers with a blend of discipline and timing.
Consider the walk, baseball’s most underrated weapon. A batter who draws a walk doesn’t just advance; they disrupt the pitcher’s rhythm, force the defense into uncomfortable alignments, and plant the seeds of chaos. Ted Williams, one of the greatest hitters of all time, famously said, “The most important thing in hitting is to get a good ball to hit.” But what if the pitcher never gives you one? A high OBP turns this frustration into an offensive advantage. Players like Joey Votto and Barry Bonds didn’t just hit—they weaponized the walk, turning it into a tool of relentless pressure. In the calculus of OPS, OBP is the foundation upon which run production is built, the first domino that sets the rest in motion.
Slugging Percentage: The Thunderous Crescendo of Power
If OBP is the architect of rallies, slugging percentage (SLG) is the explosive finale, the thunderclap that announces a batter’s dominance. Where OBP is a study in finesse, SLG is a declaration of force. It doesn’t just count hits; it weighs them, assigning values based on the distance traveled: a single is a whisper, a double a murmur, a triple a shout, and a home run a deafening roar. A player with a .600 SLG is a human wrecking ball, capable of turning a game on its head with a single swing.
The beauty of SLG lies in its ability to capture the spectacle of baseball. There’s something primal about watching a ball soar over the fence, the crack of the bat echoing through the stadium like a gunshot. But power isn’t just about home runs. A batter who consistently drives in runs with doubles and triples is the architect of late-inning comebacks, the player who turns a 1-0 deficit into a 4-1 lead with a single swing. In the context of OPS, SLG is the fire that ignites the engine of run production, the force that propels a team from mediocrity to greatness.
OPS in Action: The Alchemy of Numbers and Narrative
To truly grasp the power of OPS, one must witness it in action. Take Mike Trout, a player whose offensive prowess is as much a part of his legend as his defensive brilliance. Trout’s career OPS hovers around .990, a figure that places him among the game’s all-time greats. But what does that number really mean? It means that for every three plate appearances, Trout is likely to reach base and advance runners at a rate that would make even the most optimistic fan swoon. It means that when Trout steps into the box, the odds of a rally skyrocket.
Contrast this with a player like Adam Dunn, whose prodigious power was matched only by his proclivity for strikeouts. Dunn’s career OPS was a respectable .859, but his OBP (.365) was dragged down by his 2,379 strikeouts—the most in MLB history. While Dunn’s SLG (.494) was elite, his inability to avoid outs limited his overall impact. OPS doesn’t just reward power; it rewards efficiency. It’s the difference between a player who dominates a game and one who dominates a stat sheet.
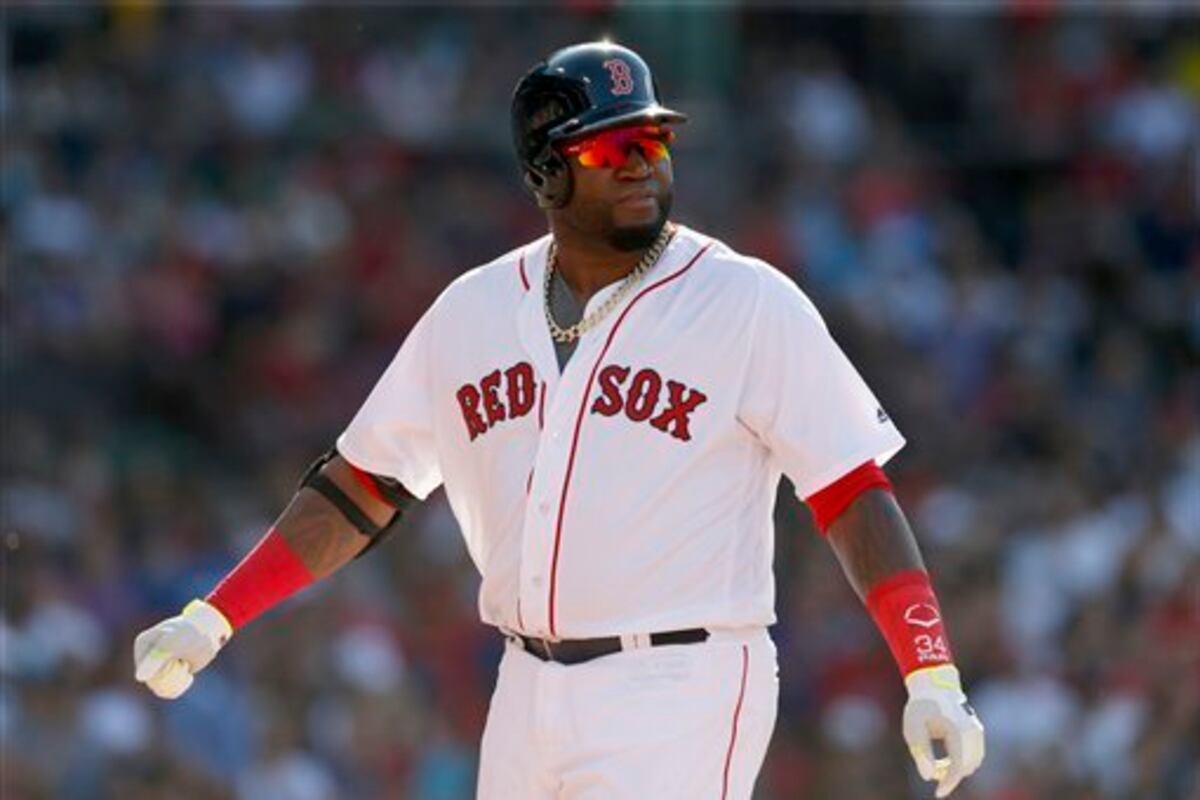
In the crucible of the postseason, OPS takes on an almost mythic significance. Clutch performances are often measured in clutch hits, but OPS provides a broader lens. A player with a high OPS in October isn’t just a hero in the moment; they’re a player whose offensive profile suggests they thrive under pressure. Think of David Ortiz in the 2013 World Series, his OPS of 1.200 a testament to his ability to deliver when it mattered most. OPS doesn’t just quantify performance; it narrates the story of a player’s greatness.
The Limitations of OPS: A Flawed Masterpiece
No stat is without its flaws, and OPS is no exception. Its simplicity is both its strength and its Achilles’ heel. By combining OBP and SLG, OPS gives equal weight to two fundamentally different skills, as if equating a surgeon’s precision with a blacksmith’s strength. In reality, OBP is often more valuable than SLG, as avoiding outs is the surest path to run production. A player with a .400 OBP and .400 SLG (an OPS of .800) is far more valuable than one with a .300 OBP and .500 SLG (also an OPS of .800), yet OPS treats them as equals.
Moreover, OPS ignores context. It doesn’t account for the ballpark a player calls home, the quality of the pitching they face, or the defensive alignments they exploit. A .900 OPS in Coors Field is not the same as a .900 OPS in Petco Park. Similarly, OPS doesn’t measure a player’s ability to hit in high-leverage situations or their knack for advancing runners without getting a hit. It’s a blunt instrument in a world of precision tools.
For these reasons, advanced metrics like wOBA (Weighted On-base Average) and wRC+ (Weighted Runs Created Plus) have gained traction among analysts. These stats account for the nuances that OPS overlooks, providing a more nuanced picture of a player’s offensive value. Yet even in the age of big data, OPS remains a beloved metric, a gateway drug for fans eager to dive deeper into the numbers. Its simplicity makes it accessible, its narrative power makes it memorable, and its flaws make it human.
The Cultural Impact of OPS: From Stathead to Stadium Roar
OPS has transcended the realm of numbers to become a cultural touchstone in baseball. It’s the stat that fuels debates in barrooms and broadcasts, the figure that separates the good from the great in the eyes of fans. When a player’s OPS climbs above 1.000, it’s not just a milestone; it’s a badge of honor, a declaration that they’ve entered the pantheon of offensive excellence. When a team’s collective OPS dips below .700, it’s a red flag, a sign that the offense is sputtering like an engine running on fumes.
OPS has also given rise to new lexicon in baseball fandom. Terms like “OPS+” (a park- and league-adjusted version of OPS) and “OPS league” (a hypothetical league where all players have an OPS of 1.000) have entered the vernacular, a testament to the stat’s ubiquity. It’s the kind of metric that invites speculation, comparison, and argument—exactly the kind of fuel that keeps baseball’s fires burning.
In the end, OPS is more than a number. It’s a storyteller, a lens, and a rallying cry. It captures the essence of what makes baseball so compelling: the interplay of skill, strategy, and spectacle. Whether you’re a fan who watches the game for the love of the sport or an analyst who dissects it for the thrill of discovery, OPS is your guide. It’s the stat that turns the abstract into the tangible, the numbers into narratives, and the game into a symphony of human achievement.